
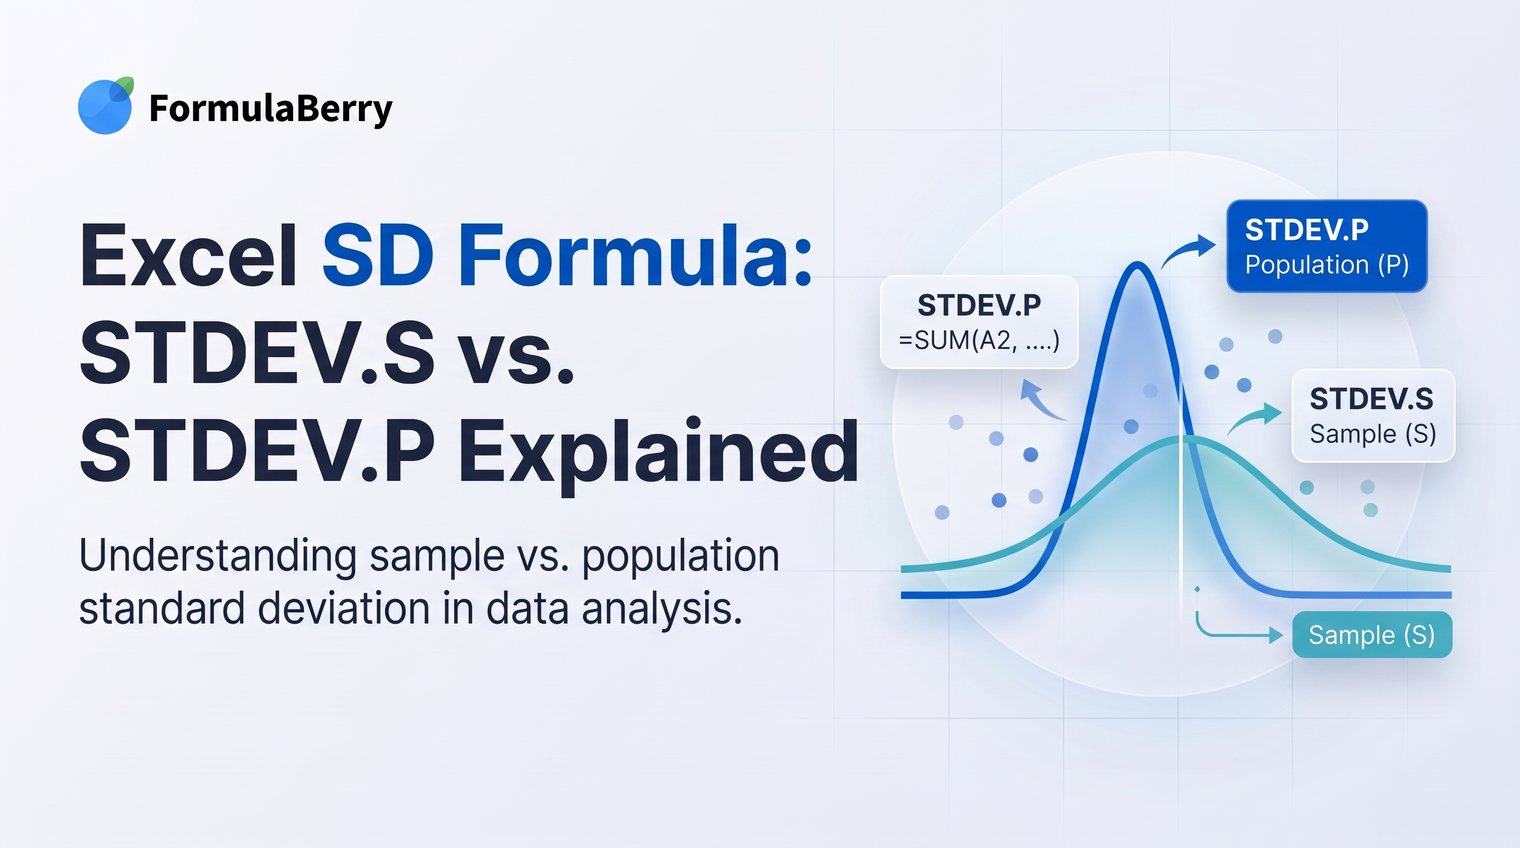
For most Excel work, use STDEV.S. It calculates standard deviation for a sample of a larger group. Use STDEV.P only when your worksheet contains every value in the population you want to analyze.
The distinction matters because the two functions produce slightly different results. Choosing the right Excel SD formula starts with one question: are these all the relevant observations, or just a subset?
The Excel SD formula: STDEV.S for samples, STDEV.P for populations
Excel offers two current standard deviation functions:
- =STDEV.S(number1, [number2], ...) for a sample
- =STDEV.P(number1, [number2], ...) for a complete population
For example, if sales figures are in cells B2 through B13, enter =STDEV.S(B2:B13) to calculate sample standard deviation. If those 12 figures represent every member of the group under study, use =STDEV.P(B2:B13) instead.
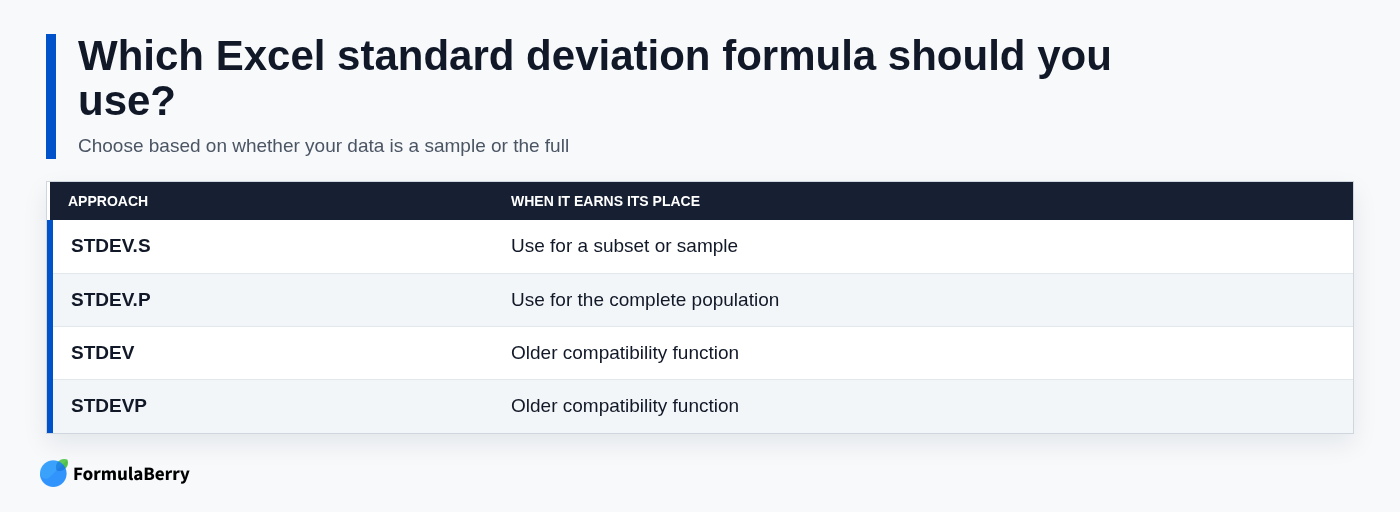
Excel also retains the older STDEV and STDEVP functions for compatibility with older workbooks. They still work, but new spreadsheets should use STDEV.S and STDEV.P because their names make the intended use clearer.
What standard deviation tells you about your data
Standard deviation measures how widely values are spread around their average, or mean. A low standard deviation means the values tend to stay close to the average. A high standard deviation means they vary more widely.
Imagine two stores with average weekly sales of $10,000. Store A records sales between $9,700 and $10,300 most weeks, while Store B ranges from $5,000 to $15,000. Both may have the same average, but Store B has a much higher standard deviation because its results are less consistent.
That makes standard deviation useful for spotting volatility in budgets, sales, delivery times, test scores, quality measurements, and many other spreadsheet reports. It does not tell you whether a result is good or bad on its own; it tells you how consistent the results are in the units you are measuring.
How to calculate standard deviation in Excel
Calculating SD in Excel is straightforward once you have chosen between sample and population data.
- Put your numeric values in a worksheet range.
- Select an empty cell where you want the result to appear.
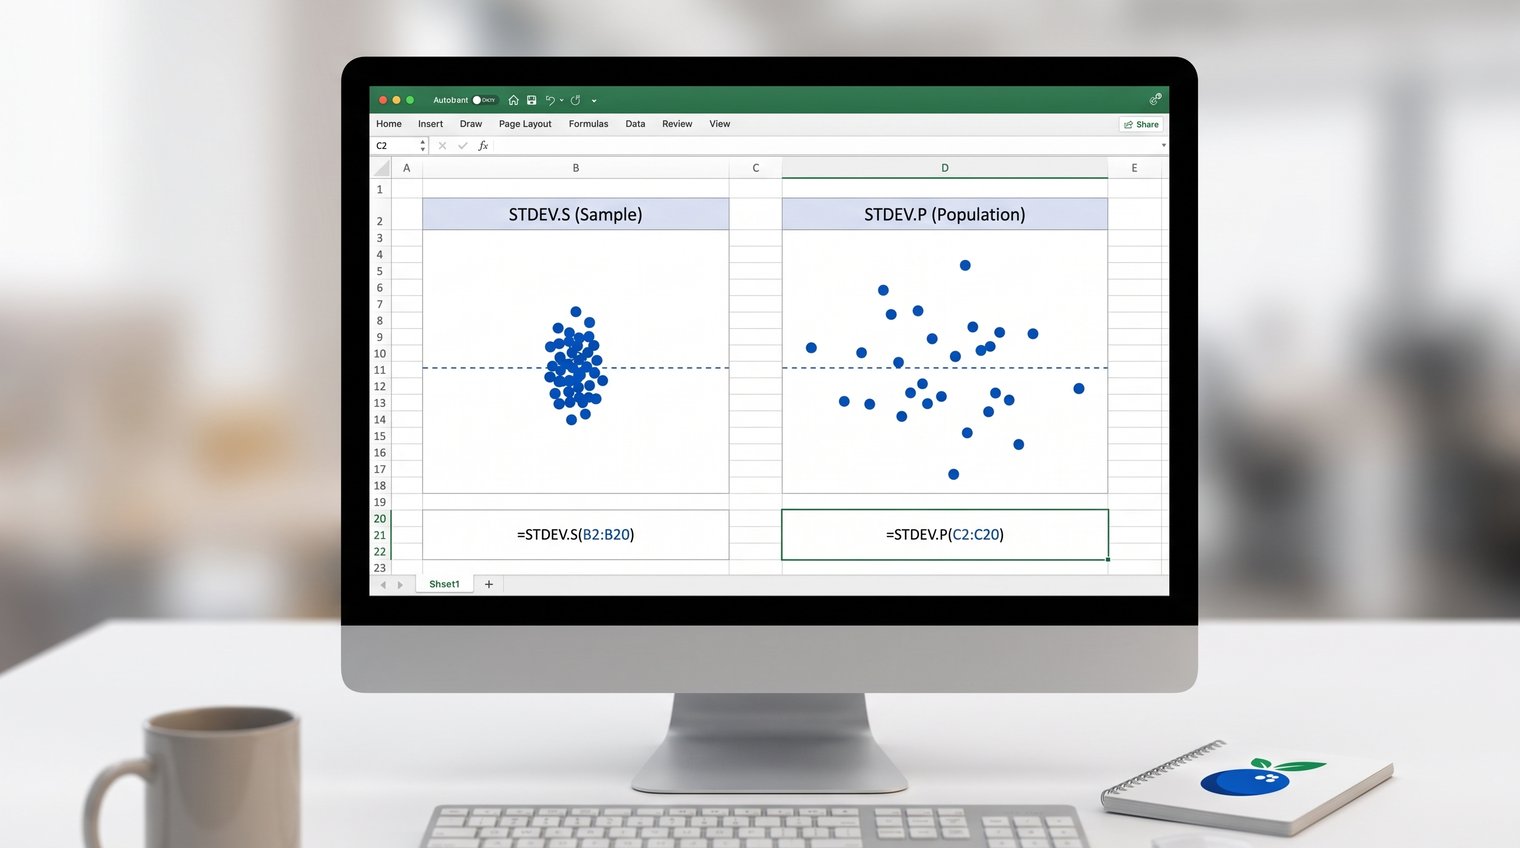
- Enter the appropriate formula, such as =STDEV.S(B2:B13).
- Press Enter.
Excel calculates the result immediately. In a referenced range, blank cells and text entries are ignored. That is convenient when a report has occasional empty rows, but it is still worth checking that your selected range contains only the records you intend to analyze.
Calculate SD for a sample with STDEV.S
Use STDEV.S when your data is a selection from a broader group or ongoing process. A customer survey, a quality-check sample from a production run, or 50 selected transactions from a year of sales are all sample-data situations.
If monthly survey scores are in C2:C51, use:
=STDEV.S(C2:C51)
STDEV.S estimates the variation you would expect across the larger population based on the observations you collected. This is why it is the better default for business analysis: most worksheets contain a portion of all possible results, not the complete universe of results.
Calculate SD for a full population with STDEV.P
Use STDEV.P only when the range includes every observation in the group you are defining. For example, if a small department has 18 employees and your worksheet includes every one of their annual assessment scores, those 18 values are the population for that department-level analysis.
If the scores are in D2:D19, use:
=STDEV.P(D2:D19)
Population does not mean "a lot of rows." It means complete data for the exact group you care about. A file with 10,000 transactions can still be a sample if it represents only part of a company's total transactions or only a portion of the time period being studied.
STDEV.S vs. STDEV.P: the difference in the calculation
The formulas differ in how they divide the total squared variation. STDEV.P divides by the number of observations, n. STDEV.S divides by one less than the number of observations, n - 1.
You do not need to perform that calculation manually in Excel, but the result is important: STDEV.S is usually slightly larger than STDEV.P when both use the same values. The difference is more noticeable in small datasets and becomes less significant as the number of observations increases.
That adjustment in STDEV.S prevents a sample from understating the variability of the larger population it represents. It is not an Excel quirk or an error; it is the intended statistical treatment.
How to calculate mean and standard deviation together
Standard deviation is easiest to interpret alongside the mean. The mean tells you the typical value, while standard deviation tells you how much values tend to move away from it.
For values in B2:B13, use these formulas in separate cells:
=AVERAGE(B2:B13)
=STDEV.S(B2:B13)
Suppose the average weekly sales figure is $8,000 and the standard deviation is $400. That suggests sales are fairly consistent. If the same average has a standard deviation of $3,000, weekly performance is much less predictable.
Always keep the units in mind. A standard deviation of 10 can be minor for annual revenue measured in thousands of dollars, but substantial for delivery time measured in minutes.
Calculate standard deviation across multiple columns
You can calculate one standard deviation across more than one range by listing each range in the same formula. For example:
=STDEV.S(B2:B13,D2:D13)
This combines the numeric values in columns B and D before calculating the sample standard deviation. It is appropriate when both columns contain the same kind of measurement from comparable groups, such as order totals from two regions using the same currency and reporting period.
To calculate a separate SD for each column, enter a relative-reference formula in a summary row and copy it across. For example, if values run from B2:B13, enter =STDEV.S(B2:B13) beneath that column. When copied right, Excel adjusts the reference to the next column.
Do not combine columns simply because they are adjacent. Mixing sales revenue with units sold, percentages with dollar values, or two different populations creates a number that is mathematically valid but analytically meaningless.
Calculate standard deviation in Excel with a condition
Sometimes you need standard deviation for only one segment of your data, such as sales from the East region, orders marked Complete, or records within a chosen date period. In modern Excel, combine FILTER with STDEV.S or STDEV.P. For date-based criteria, see this Excel Date Formula Guide.
For instance, if regions are in B2:B100 and sales values are in C2:C100, calculate sample standard deviation for the East region with:
=STDEV.S(FILTER(C2:C100,B2:B100="East"))
FILTER first returns the sales values associated with East, then STDEV.S calculates variation for those values. You can replace "East" with a cell reference, such as E2, to make the formula easier to reuse in a report.
Older Excel versions without FILTER may require an array formula or a helper column that identifies qualifying rows. Whichever method you use, make sure the filtered set includes enough numeric observations. A sample standard deviation needs at least two numbers, and a result based on only a few records may not be useful for decision-making.
How to calculate standard deviation from a mean in Excel
Knowing the mean alone is not enough to calculate standard deviation. You also need the individual values, or at least each value's distance from the mean. Two datasets can have the same average and very different levels of spread.
For learning or auditing purposes, the manual process is:
- Calculate each value minus the mean.
- Square each deviation.
- Add the squared deviations. For larger ranges, an Excel SUM formula can help total them.
- Divide by n for a population or n - 1 for a sample.
- Use SQRT to find the square root of that result.
For routine work, use STDEV.S or STDEV.P instead. They are clearer, faster, and less prone to errors caused by inconsistent references or missed rows.
Common Excel SD formula mistakes to avoid
The most common mistake is choosing STDEV.P because the dataset appears complete. Ask whether it is complete for the broader group you want to understand, not merely whether every row in your current export is filled in. If you sampled customer orders, employees, products, or dates from a larger process, STDEV.S is generally the right choice.
Range errors are another frequent problem. A formula can return a perfectly plausible result while including header-adjacent values, a different reporting period, duplicate records, or a column measured in another unit. Verify the selected range before trusting the output.
Also avoid reading a standard deviation without its mean and units. A value of 25 has no useful meaning unless you know whether it represents $25, 25 minutes, 25 percentage points, or something else, as well as the average it is being compared with.
Finally, keep analysis ranges clean. In referenced ranges, blank cells, text, and TRUE/FALSE values are ignored. But when TRUE/FALSE values or text representations of numbers are typed directly as function arguments, Excel can evaluate them differently. A consistent numeric data column is safer than relying on Excel to interpret mixed entries.
Use the right SD formula, then validate the range
Use STDEV.S when your numbers are a sample, which is the default in most real-world spreadsheet analysis. Use STDEV.P only when you have every observation in the population you have defined.
Then check the range, confirm that the values use the same measure and time frame, and interpret the result alongside the mean. If you need help building, explaining, or fixing an Excel or Google Sheets standard-deviation formula, FormulaBerry's Excel Formula Generator can generate guidance from a plain-language request.