
A doubled balance sounds simple until you need to report what it means per year. Saying an investment rose 100% over five years is accurate, but it is not the same as saying it earned 20% every year. Compounding changes the answer.
Excel's RRI function gives you the equivalent annual growth rate in one formula. In the worked example below, a value rising from $10,000 to $20,000 over five years produces an annual compounded rate of 14.87%.
The result: a 14.87% equivalent annual growth rate
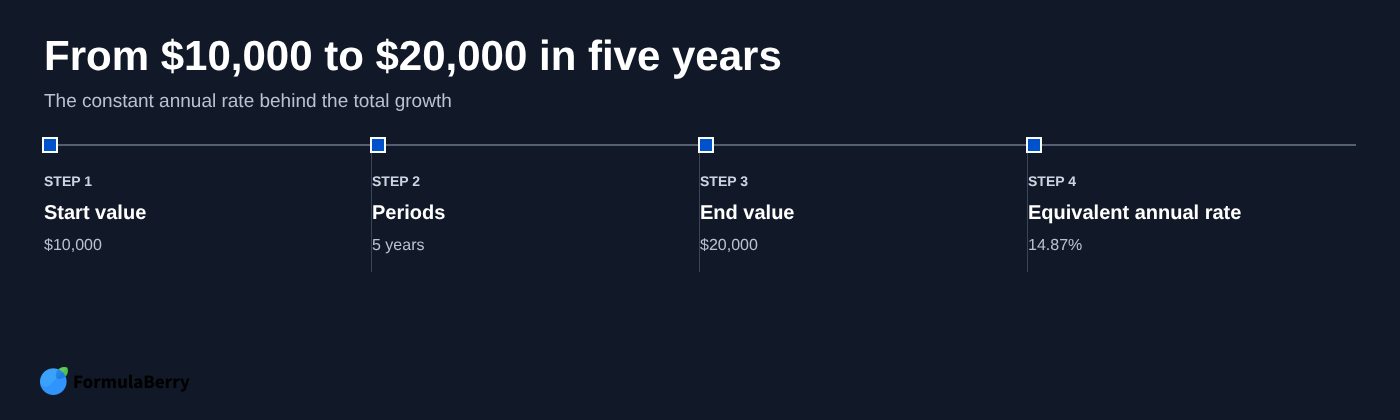
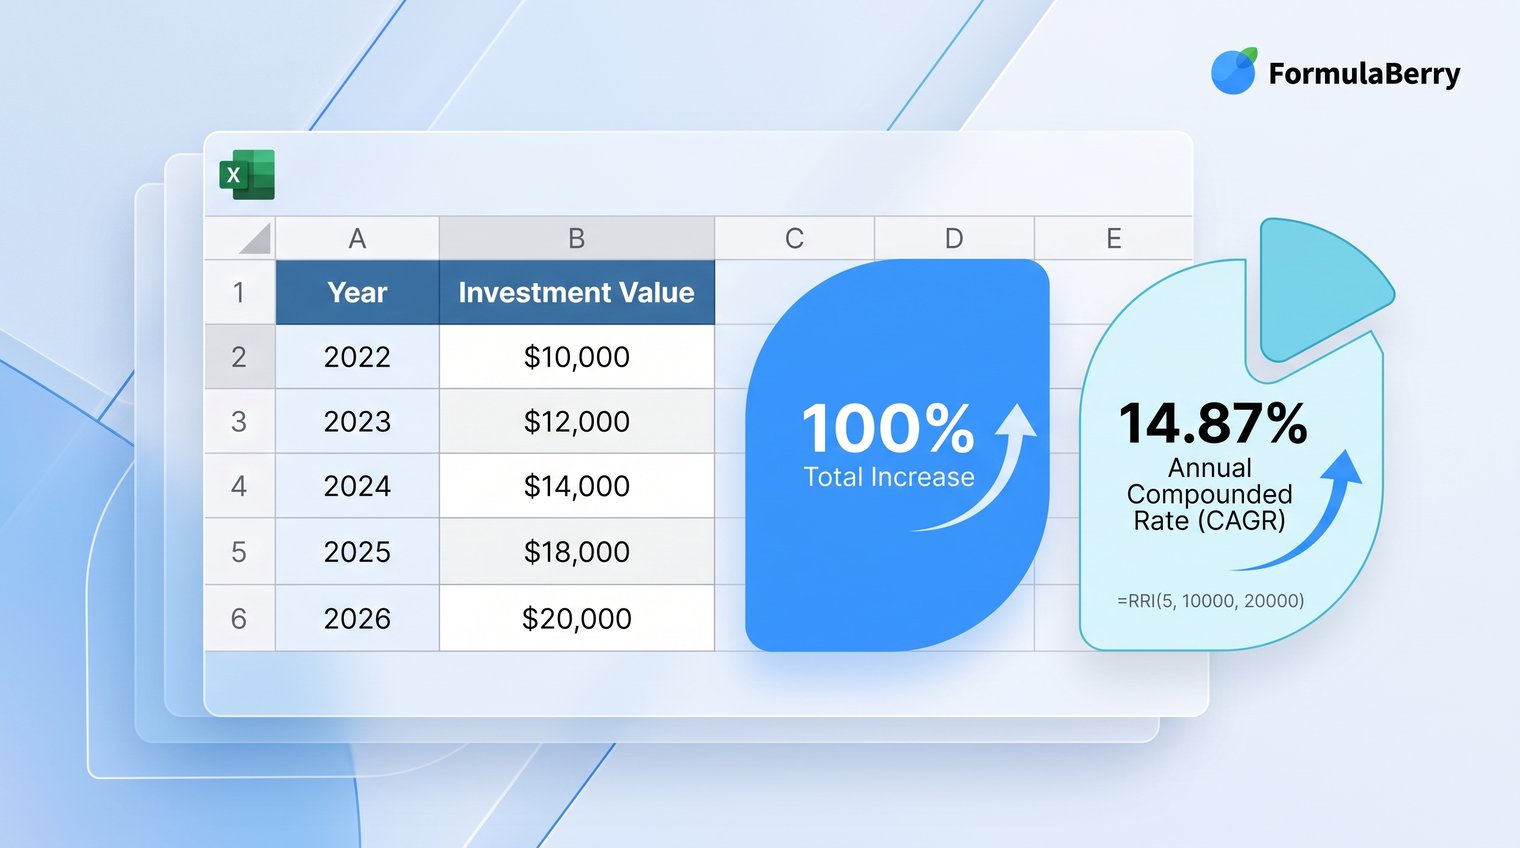
Suppose an investment, savings balance, or business metric grows from $10,000 to $20,000 over five years. The Excel formula is:
=RRI(5,10000,20000)
The result is approximately 14.87%. This is the constant annual rate that would turn $10,000 into $20,000 in five years if growth compounded evenly.
It does not mean the value actually rose by 14.87% in every year. The real path may have included a loss in one year, a sharp gain in another, or no growth at all for several months. RRI summarizes the start-to-end result as one comparable annual rate.
What the RRI function does in Excel
RRI is Excel's equivalent annual interest-rate function. For anyone searching for a CAGR formula in Excel, it is a concise built-in option when you have a beginning value, an ending value, and a known number of periods.
In practical terms, RRI answers this question: "What fixed compounded rate would get me from this starting number to that ending number in this amount of time?" It is useful for investments, sales growth, subscriber counts, operating costs, budgets, and almost any metric with two comparable endpoints.
The key word is compounded. RRI is not a simple average. A total increase of 100% over five years cannot be divided by five to produce a reliable annual growth rate, because each year's increase builds on the previous year's value.
RRI syntax and argument meanings
The syntax is:
=RRI(nper, pv, fv)
- nper is the number of equal compounding periods, such as years, quarters, or months.
- pv is the present value, or the starting value.
- fv is the future value, or the ending value.
For a straightforward growth calculation, using positive numbers for the starting and ending values is usually easiest. More importantly, the period count must match the frequency of the values you are comparing.
Case study setup: calculate CAGR with RRI
Consider this representative example: a small business owner wants to summarize five years of revenue growth for a planning meeting. Revenue was $10,000 at the start of the period and $20,000 at the end.
| Worksheet item | Value |
|---|---|
| Starting value at Year 0 | $10,000 |
| Ending value at Year 5 | $20,000 |
| Elapsed periods | 5 years |
The correct value for nper is five. This is a common source of mistakes because a worksheet may show six labels: Year 0, Year 1, Year 2, Year 3, Year 4, and Year 5. Those labels mark six points in time, but there are only five growth intervals between the first and last point.
At a smooth equivalent rate of 14.87%, the value would compound from $10,000 to about $20,000 by the end of Year 5. That smooth path is useful for comparison, but it is not a reconstruction of the actual year-by-year performance.
Build the RRI formula step by step
For values entered directly in the formula, use:
=RRI(5,10000,20000)
In a worksheet, cell references are more practical. If B2 contains the starting value, B3 contains the ending value, and B4 contains the number of years, use:
=RRI(B4,B2,B3)
Excel is calculating the same underlying expression:
=(20000/10000)^(1/5)-1
The calculation finds the fifth root of 2, then subtracts 1 to convert the growth multiplier into a rate. The unformatted result is a decimal, approximately 0.1487. Format the formula cell as a percentage and choose suitable decimal places, such as two, to display 14.87%.
FormulaBerry
If formula syntax is the obstacle rather than the math, FormulaBerry can turn a plain-language request into an Excel or Google Sheets formula. For example, you could ask for the annual compounded growth rate from $10,000 to $20,000 over five years, then request an explanation of each part of the result.
That is particularly useful when your values are in cells and you need the formula adjusted to your worksheet layout. FormulaBerry can generate, explain, and help correct formulas, but it does not replace the need to confirm your inputs. You still need to decide whether your period count is years, months, quarters, or another consistent interval.
Before and after: total growth is not annual growth
The case study begins with $10,000 and ends with $20,000. That is a 100% total increase. It is tempting to divide 100% by five years and report 20% annual growth, but that shortcut ignores compounding.
If the balance actually grew at 20% per year for five years, it would not end at $20,000. It would reach:
$10,000 x 1.205 = $24,883.20
That is why the CAGR and growth formula in Excel returns 14.87% instead. At that annual compounded rate, the starting value doubles over five years. When you need to calculate CAGR in Excel, use RRI with the elapsed periods and the two endpoints rather than averaging the total percentage change.
Verify the answer with the manual CAGR formula
RRI is convenient, but the manual CAGR formula is worth knowing because it makes the calculation transparent:
=(Ending_Value/Beginning_Value)^(1/Number_of_Years)-1
Using the same numbers, enter:
=(20000/10000)^(1/5)-1
The answer is again approximately 14.87%. This is not a competing method; it is the math behind RRI expressed directly in the sheet.
The manual version is useful when you need formula portability, when a reviewer wants to see the logic without looking up a function, or when you are working in a spreadsheet environment where RRI is unavailable. It is also a sensible cross-check for an important financial or reporting calculation.
Use RRI correctly when periods are months or quarters
RRI does not know whether your periods are years, months, or quarters. It simply returns the rate per period. That means the frequency of nper must match the frequency represented by the start and end values.
For example, if $10,000 becomes $20,000 over 60 months, use:
=RRI(60,10000,20000)
The result is a monthly compound rate, not an annual CAGR. If the monthly result is in cell B5 and you want to annualize it, use:
=(1+B5)^12-1
The same principle applies to quarters. Use the number of quarters as nper, understand that RRI returns a quarterly rate, then compound it over four quarters if you need an annualized figure. Do not label a monthly or quarterly RRI output as an annual rate without converting it.
Common RRI formula errors and how to fix them
Most RRI mistakes are input mistakes, not Excel mistakes. A formula can be perfectly valid and still produce a misleading answer if the values or period count do not represent the same growth interval.
- Using the wrong number of periods: Count elapsed intervals, not the number of date labels or rows in your sheet.
- Mixing frequencies: Do not use 60 months as the period count and describe the output as a yearly rate.
- Misreading decimals: A result of 0.1487 is 14.87%, not 0.1487%.
- Using noncomparable values: Beginning and ending values should measure the same thing, using the same units and basis.
- Using zero or negative values: Standard CAGR and RRI calculations become problematic when a starting or ending value is zero or negative, because the usual compounding interpretation breaks down.
When accuracy matters, verify the result with the manual CAGR formula. If the two formulas disagree, inspect the cell references, the number of periods, and the formatting before drawing a conclusion from the rate.
Counting dates instead of elapsed compounding periods
Return to the Year 0 through Year 5 example. There may be six dated entries in the spreadsheet, but growth occurs across five intervals: 0 to 1, 1 to 2, 2 to 3, 3 to 4, and 4 to 5.
For dates that do not fall exactly on whole-year boundaries, calculate the elapsed time as a year fraction rather than forcing an integer count. This is especially important when comparing values recorded on dates such as March 15 and November 30 across several calendar years.
Treating an uneven history as steady annual performance
RRI tells a clean start-to-finish story, but it hides the journey. A business could have grown quickly, stalled, then recovered; an investment could have experienced significant declines before ending higher.
Use RRI when you need one equivalent compounded rate for comparison or reporting. If the year-by-year path matters, pair the CAGR with annual returns, periodic revenue figures, or a chart. Do not let a smooth annualized number imply a smooth real-world history.
When RRI is the right Excel shortcut - and when it is not
RRI is the right Excel shortcut when you have one starting value, one ending value, and a known number of equal periods. It is concise, readable, and directly suited to calculating an equivalent compounded growth rate.
Use the manual CAGR formula when transparency or portability matters more than a shorter function. It is also helpful for teaching the calculation or auditing a workbook, since every part of the math is visible in the formula.
RRI is not the right tool for a series of deposits, withdrawals, or cash flows occurring on irregular dates. In those cases, XIRR is usually more appropriate because it accounts for dated cash flows. RRI assumes one initial value and one final value, not a changing set of contributions in between.
Apply the same method to your own growth calculation
Use this simple worksheet pattern for your own CAGR calculation:
- Enter the starting value.
- Enter the ending value.
- Enter the number of elapsed periods at the same frequency as the values.
- Use =RRI(periods, starting_value, ending_value).
- Format the result as a percentage.
- Check the result with the manual CAGR formula if the figure will inform a decision or report.
For the worked example, =RRI(5,10000,20000) returns 14.87% because that is the single compounded annual rate required to double the value in five years. If you need help generating the formula, understanding its parts, or fixing a reference issue, FormulaBerry can work from a plain-language request.
The decision rule is straightforward: use RRI when you need one equivalent compounded growth rate between two endpoints over a known number of periods.