
A bond can look straightforward until you try to turn its coupon, market price, and maturity date into one useful return number. The manual yield-to-maturity equation is iterative, which is exactly why Excel's built-in bond functions matter.
For a representative example, take a $1,000 par bond with a 10% annual coupon paid semiannually, nine years remaining to maturity, and a market price of $900. Excel's YIELD function produces an annual yield to maturity of approximately 11.8%. You do not need to solve the yield-to-maturity formula by trial and error yourself.
The result first: YIELD returns the bond's annual yield to maturity
Excel's YIELD function calculates a bond's annualized yield to maturity from its settlement date, maturity date, coupon rate, quoted price, redemption value, payment frequency, and day-count basis.
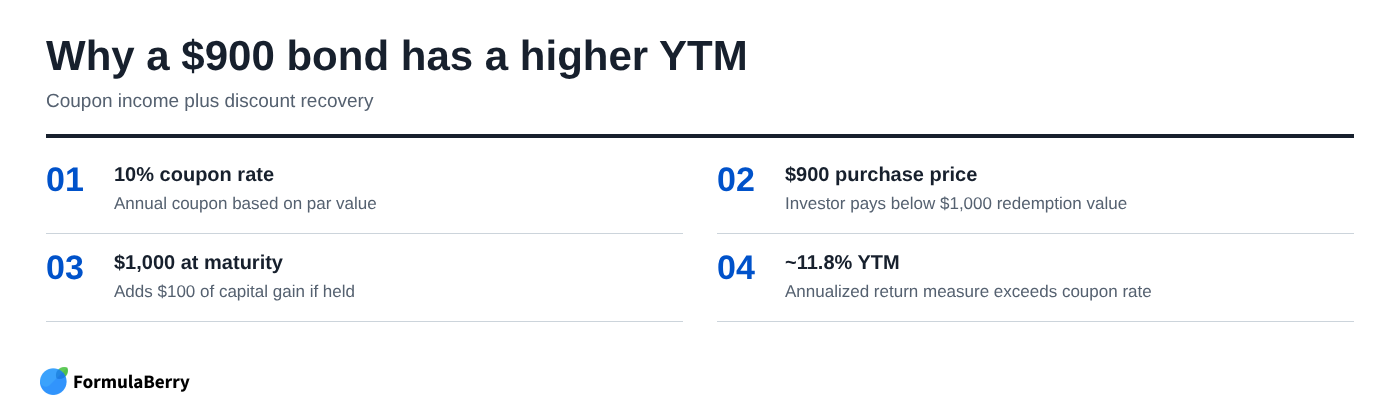
In the illustrative case used throughout this article, the bond pays a 10% annual coupon but trades below par at $900. Because an investor buys it at a discount and receives $1,000 at maturity, its yield to maturity is higher than its coupon rate: roughly 11.8%.
The result is annualized. You enter 2 for a semiannual bond, and Excel accounts for that payment convention when it calculates the annual YTM.
The YTM Excel formula: YIELD syntax and what each argument means
The YTM Excel formula is:
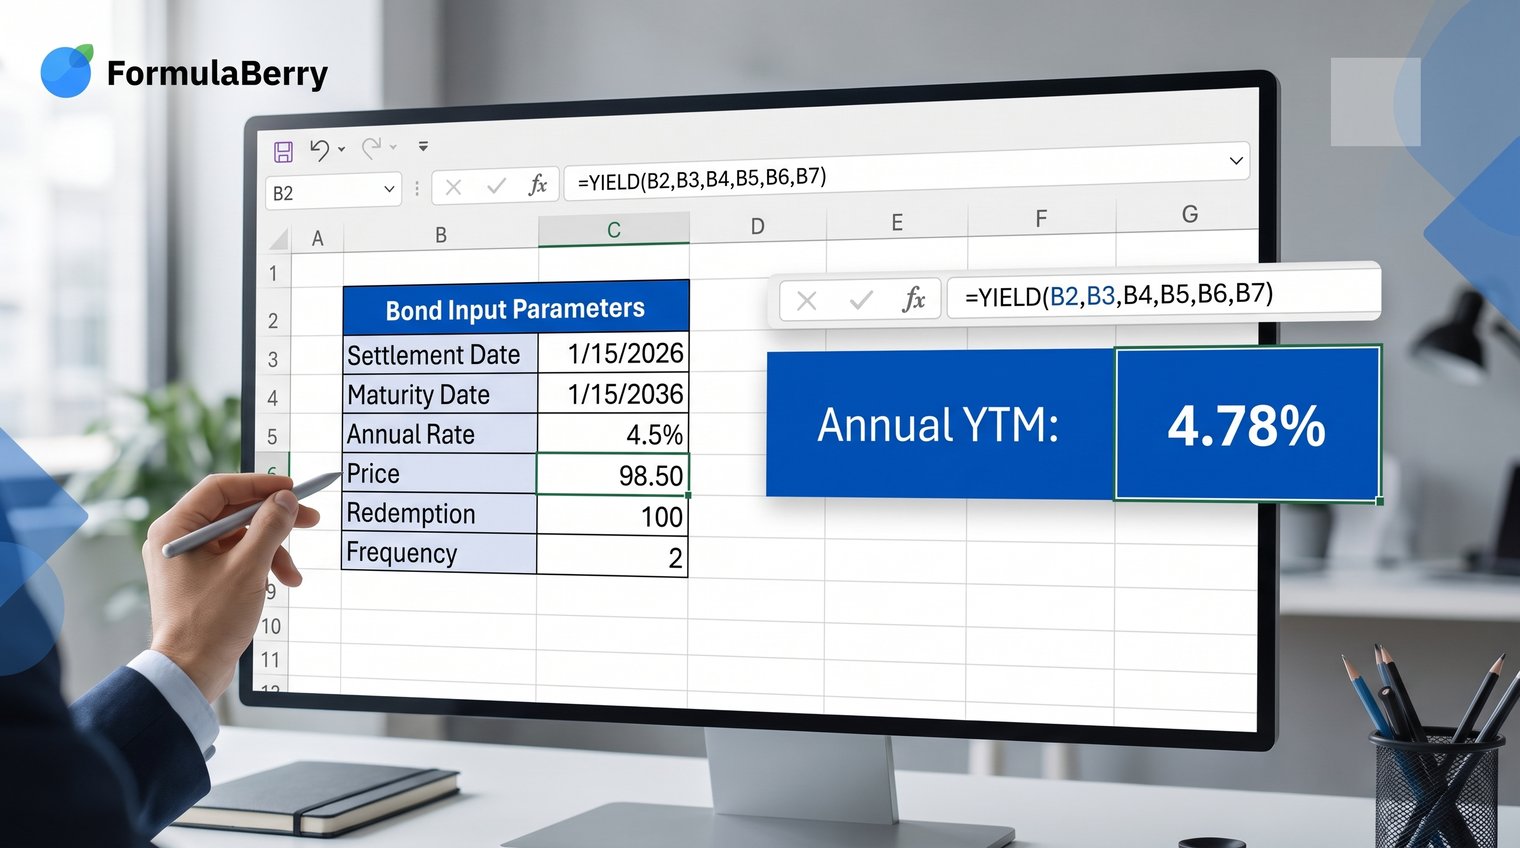
=YIELD(settlement, maturity, rate, pr, redemption, frequency, [basis])
Each input matters because Excel assumes a conventional fixed-rate bond structure. Dates must be valid Excel dates, rate is the stated annual coupon rate, pr is the bond price per $100 of face value, and redemption is normally 100.
The price convention causes many avoidable errors. If a $1,000-par bond is worth $900, do not enter 900 as the price argument. Its quoted price is 90 per $100 of par.
Settlement and maturity dates
The settlement date is the date the buyer takes ownership of the bond. It is not always the same as the trade date. The maturity date is when the issuer repays principal, assuming the bond is held until maturity.
Settlement must be earlier than maturity. Use actual Excel dates or the DATE function, such as =DATE(2026,1,15), instead of ambiguous text like 1/15/26 that may be interpreted differently under another regional date format. For more help working with dates, see this Excel Date Formula Guide.
Rate, price, and redemption
Enter the stated annual coupon rate as a percentage or decimal. A 10% coupon can be entered as 10% or 0.10. Price and redemption must both use a per-$100-face-value convention.
In this example, a $900 market value on $1,000 par converts to a price of 90:
$900 / $1,000 x 100 = 90
Likewise, the $1,000 payment at maturity becomes a redemption value of 100. Excel does not need the bond's full par amount when both price and redemption are consistently normalized.
Frequency and day-count basis
The frequency argument tells Excel how often the bond pays coupons:
- 1 for annual payments
- 2 for semiannual payments
- 4 for quarterly payments
The optional basis argument selects the day-count convention. Excel uses 0, US 30/360, by default. That may be appropriate for many corporate bond examples, but the correct choice is the convention stated in the bond's terms or the market data source. A difference in basis or dates can produce a slightly different YTM than a quoted market yield.
Worked example: calculate YTM for a discounted semiannual bond
Suppose an investor is evaluating a conventional fixed-rate bond with a $1,000 par value. The bond has a 10% annual coupon, pays interest twice a year, matures in nine years, and can be purchased today for $900.
For a reproducible worksheet, use January 15, 2026 as the settlement date and January 15, 2035 as the maturity date. The bond trades at a discount, so its YTM should be above 10% before you enter any formula. The investor receives the same coupon based on par value, but pays less than par to acquire the bond.
Step 1: turn the bond terms into Excel inputs
| Cell | Input | Value |
|---|---|---|
| B2 | Settlement date | 1/15/2026 |
| B3 | Maturity date | 1/15/2035 |
| B4 | Annual coupon rate | 10% |
| B5 | Quoted price per $100 | 90 |
| B6 | Redemption per $100 | 100 |
| B7 | Payment frequency | 2 |
| B8 | Day-count basis | 0 |
The coupon payment is useful for understanding the cash flows, even though it is not entered directly into YIELD. This bond pays:
$1,000 x 10% / 2 = $50 every six months
Do not substitute $50 for the rate argument. Excel needs the annual coupon rate and the frequency separately.
Step 2: enter the YIELD formula
In the cell where you want the annual YTM, enter:
=YIELD(B2,B3,B4,B5,B6,B7,B8)
Format the output as a percentage and keep at least two decimal places if you are comparing several bonds. This Excel percentage formula guide can help if you need to format or compare percentage results. With these illustrative inputs, the result is approximately 11.8%. The exact output can differ slightly if you use different settlement dates or a different day-count basis.
A direct-value version is also possible, although cell references make the worksheet easier to audit and reuse:
=YIELD(DATE(2026,1,15),DATE(2035,1,15),10%,90,100,2,0)
Before and after: why the YTM is higher than the coupon rate
The 10% coupon rate and the roughly 11.8% YTM answer different questions. The coupon rate determines the bond's scheduled interest payments based on par value. In this case, that means $100 a year on a $1,000 bond, paid as two $50 installments.
YTM goes further. It annualizes the coupon income, the $100 gain from buying at $900 and receiving $1,000 at maturity, and the time value of money across the remaining life of the bond.
That is why a discount bond normally has a YTM above its coupon rate. The opposite is generally true for a premium bond: paying more than par reduces the return because the investor receives only par at maturity.
YTM is still a standardized measure, not a guaranteed realized return. It assumes the bond is held to maturity and that coupon payments can be reinvested at the YTM. If the investor sells early, defaults occur, or reinvestment rates differ, the realized return can differ.
Check the answer with Excel's bond price formula
A useful way to validate a YTM calculation is to run the relationship in reverse. Excel's PRICE function calculates a bond's quoted price from the same bond terms and a yield input:
=PRICE(settlement,maturity,rate,yld,redemption,frequency,[basis])
If you enter the YIELD result as the yld argument, PRICE should return approximately 90 for this example. That is a practical check that your dates, frequency, price convention, and day-count basis all match.
It also reinforces the basic bond relationship: when required yield rises, bond price falls, all else equal. A buyer paying $900 for this bond earns more than a buyer paying $1,000, assuming the same coupon, maturity, and repayment amount.
Use PRICE to validate the YIELD result
Assume the YIELD result is in B10. Use:
=PRICE(B2,B3,B4,B10,B6,B7,B8)
The output should be close to 90, subject to display rounding. PRICE returns a quoted price per $100 of face value, not the full dollar position value. To convert it back to a $1,000-par bond value, multiply by par divided by 100:
=PRICE(B2,B3,B4,B10,B6,B7,B8)*1000/100
That should return approximately $900.
Common YIELD formula mistakes and how to fix them
Most YIELD errors are not advanced finance problems. They come from inconsistent inputs: dates in the wrong order, a price on the wrong scale, or a payment frequency that does not match the security.
Wrong price convention: full bond price versus price per $100
The conversion rule is simple:
Quoted price = market value / face value x 100
For the worked example, $900 divided by $1,000 times 100 equals 90. Enter 90 in YIELD, not 900.
It is correct to use a $1,000 face value in a separate calculation while entering a redemption value of 100 in YIELD. The important point is that price and redemption must use the same per-$100 scale.
Using the coupon payment instead of the annual coupon rate
The rate argument is the stated annual coupon rate. For this bond, enter 10%, not the $50 semiannual payment and not 5%.
The frequency argument tells Excel that the annual 10% coupon is distributed in two payments. Reducing the rate to 5% because payments occur twice per year effectively changes the bond terms and produces the wrong yield.
Invalid dates, frequency, or basis
YIELD requires a settlement date before the maturity date. It also accepts only 1, 2, or 4 as the frequency value. A monthly-payment assumption, for example, does not fit this function's supported structure.
Basis mismatches are less obvious. If the bond documentation specifies a day-count method and the worksheet uses Excel's default basis of 0, your result may not line up with an external quote. Match the convention before assuming the formula is wrong.
Ignoring accrued interest and quotation conventions
Bond prices may be quoted as clean prices or dirty prices. A clean price excludes accrued interest; a dirty price includes it. If your market data and your comparison yield use different conventions, the numbers can appear inconsistent even when each calculation is internally valid.
When a calculated YTM differs from a market quote, first check the source's pricing convention, settlement date, day-count basis, and coupon schedule. Do not try to force agreement by changing inputs at random.
When YIELD is the right Excel function - and when it is not
YIELD is well suited to conventional fixed-rate bonds with regular coupon periods, a known redemption value, and annual, semiannual, or quarterly payments. That covers many straightforward corporate and government bond worksheet scenarios.
It is not a universal return calculator. Bonds with irregular first or final coupon periods, unusual cash-flow schedules, or structures outside standard periodic coupon payments may require a different Excel bond function or a dated cash-flow approach. Zero-coupon securities also deserve separate treatment because they do not have an ongoing coupon rate in the usual sense.
It is also important not to confuse YTM with current yield. Current yield is annual coupon income divided by current price. In this example, it would be $100 divided by $900, or about 11.11%. That ignores the additional $100 received when the discounted bond redeems at par, which is why it is lower than the approximately 11.8% YTM.
Apply this YTM worksheet to your own bond
Once the inputs are normalized, calculating bond yield in Excel becomes repeatable:
- Confirm the settlement date, maturity date, payment frequency, and day-count convention.
- Convert market price and redemption value to a consistent per-$100 basis.
- Enter the annual coupon rate, not the periodic dollar coupon payment.
- Use YIELD to calculate annualized YTM.
- Use PRICE with the YTM output to check that it returns the original quoted price.
Finally, compare the YTM with the coupon rate and the market quote. A discount bond should generally produce a YTM above its coupon rate, while a premium bond should generally produce a lower YTM. That quick reasonableness check catches many spreadsheet mistakes before they affect a report or investment comparison.
If you need help turning a plain-English spreadsheet request into an Excel or Google Sheets formula, FormulaBerry can generate, explain, and help correct the formula.