
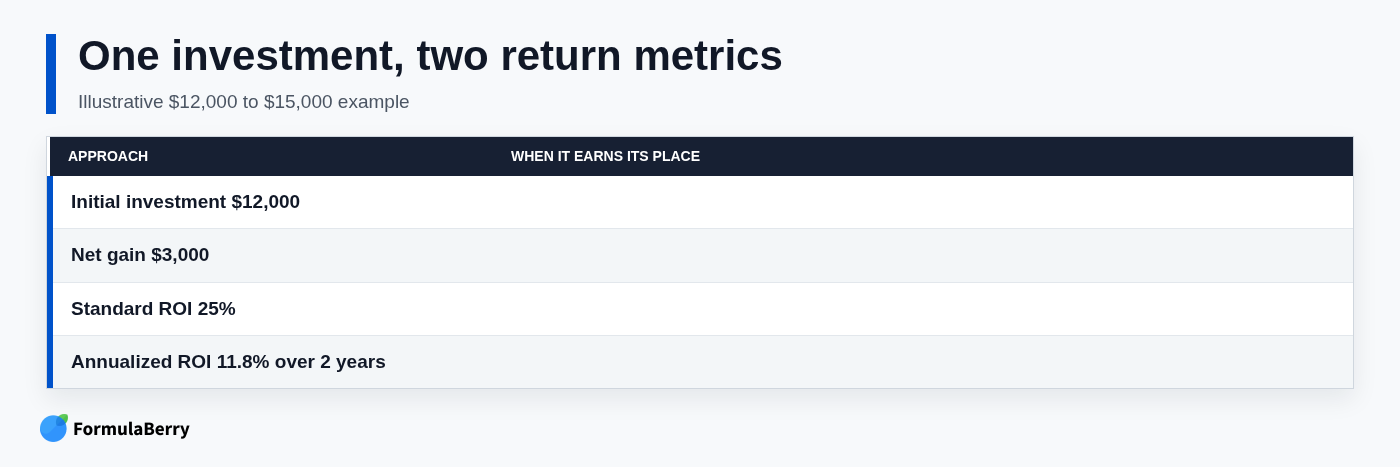
A 25% ROI can sound excellent until someone asks the obvious follow-up: "Over what period?" A $12,000 investment that becomes $15,000 delivers a 25% total return, but if it took two years, the annualized return is about 11.8%, not 25% per year.
That distinction matters whenever you compare investments, campaigns, projects, or purchases with different time horizons. This walkthrough uses a clearly labeled illustrative example and shows how to calculate both standard and annualized ROI in Excel without mixing revenue, profit, costs, and timing.
The result first: a $12,000 investment that produced a 25% ROI - and why the annualized answer is different
Illustrative case: You invest $12,000 and receive $15,000 when the investment ends two years later. Your net gain is $3,000:
$15,000 ending value - $12,000 initial investment = $3,000 net return
The standard ROI is 25% because the $3,000 gain equals one-quarter of the $12,000 invested. But the annualized ROI is approximately 11.8%, which expresses the compounded yearly return needed to turn $12,000 into $15,000 over two years.
Neither figure is more "correct." They answer different questions. Total ROI answers, "How much did this investment gain overall?" Annualized ROI answers, "What equivalent return did it earn each year?" Both depend on a consistent definition of investment cost and a return figure that is genuinely net of relevant expenses.
Choose the ROI formula that matches the question
Standard ROI is the most useful measure when you want a straightforward view of gain relative to cost. It works well for a single project, purchase, campaign, or investment where the holding period is already understood and does not need comparison with a different time period.
Annualized ROI is better when duration matters. A 25% return over six months and a 25% return over two years should not be presented as equivalent performance. Annualizing puts returns on a comparable yearly basis.
For sales and marketing work, the same core logic applies, but revenue is not automatically return. A valid sales ROI calculation should use attributable net profit, not gross sales revenue alone. Revenue can support a ROAS calculation, while profit-based ROI shows whether the investment actually paid off after relevant costs.
Standard ROI formula in Excel
The standard ROI formula in Excel is:
=(Ending_Value-Initial_Investment)/Initial_Investment
Using cell references, if the initial investment is in B2 and ending value is in B3, use:
=(B3-B2)/B2
Excel returns 0.25 for the illustrative example. That is correct: format the formula cell as a percentage. For more percentage calculations in Excel, see this guide to the Excel Percentage Formula: Calculate Percentages, Change, and Discounts. Excel displays 25%. Do not multiply by 100 in the formula if you also apply percentage formatting, or you will turn 25% into 2,500%.
Annualized ROI formula in Excel
The compound annualized ROI formula is:
=(Ending_Value/Initial_Investment)^(1/Years)-1
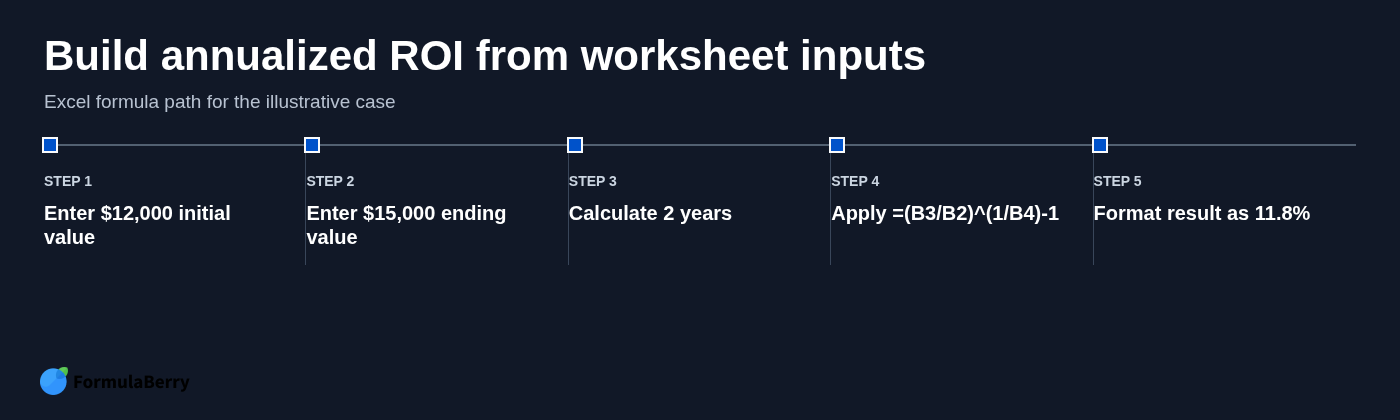
With B2 as the initial investment, B3 as ending value, and B4 as the holding period in years:
=(B3/B2)^(1/B4)-1
This is closely related to calculating compound annual growth with the RRI formula in Excel.
It is tempting to divide total ROI by the number of years. In this case, 25% divided by two gives 12.5%. That is only a rough shortcut because it ignores compounding. The compound annualized formula produces the more accurate 11.8% annual return.
Set up the worksheet so the formulas stay auditable
A clean ROI worksheet does not need dozens of columns. It does need a clear separation between raw inputs and calculated results, especially if someone else will review the analysis later.
Start with a small input block such as this:
| Cell | Label | Illustrative value |
|---|---|---|
| B2 | Initial investment | $12,000 |
| B3 | Ending value | $15,000 |
| B4 | Holding period in years | 2 |
| B5 | Net gain | =B3-B2 |
| B6 | Total ROI | =B5/B2 |
| B7 | Annualized ROI | =(B3/B2)^(1/B4)-1 |
Keeping assumptions in visible input cells makes updates simple. If the expected ending value changes, you adjust B3 once and every result updates. It also makes it easier to spot a bad assumption before it becomes a polished but misleading percentage in a report.

Calculate standard ROI in Excel: the two-year investment example
Enter $12,000 in B2, $15,000 in B3, and 2 in B4. For total ROI, enter this formula in B6:
=($B$3-$B$2)/$B$2
The calculation is:
($15,000 - $12,000) / $12,000 = $3,000 / $12,000 = 0.25
After formatting B6 as a percentage, the result is 25%. The dollar signs lock the references if you later copy the formula across a scenario table, but they are optional when calculating one result in one cell.
If you prefer an ROI formula with the net gain shown separately, calculate the gain first in B5:
=B3-B2
Then calculate ROI in B6:
=B5/B2
That layout is often easier to audit because it exposes the actual dollar gain before converting it into a percentage.
Before and after: what changes when costs are included
Suppose the $15,000 proceeds do not include $500 in transaction fees. The first calculation overstates the return because it treats gross proceeds as net value.
The real net gain is $2,500:
$15,000 - $500 - $12,000 = $2,500
The corrected ROI is:
$2,500 / $12,000 = 0.2083, or 20.83%
The practical rule is simple: include investment costs, transaction fees, and directly attributable expenses consistently. Do not subtract a cost from the numerator while also adding it to the denominator unless your reporting policy explicitly defines ROI that way. Pick a definition, label it, and apply it throughout the worksheet.
Convert total ROI into annualized ROI in Excel
For the same $12,000-to-$15,000 example over two years, enter this formula:
=(B3/B2)^(1/B4)-1
The result is approximately 11.8% when formatted as a percentage. In plain terms, an investment growing at roughly 11.8% per year, compounded for two years, would move from $12,000 to $15,000.
This is why annualized ROI is useful for comparisons. A project returning 25% over two years is not equivalent to one returning 25% in one year, even though the total ROI figure is identical.
The formula also works for fractional years, provided the holding period is calculated accurately. That matters for investments that start and end on specific dates rather than neat annual boundaries.
Calculate years from dates instead of typing them
Keep the dates separate from the original investment inputs. If your start date is in B8 and end date is in B9, calculate the fractional holding period with:
=YEARFRAC(B8,B9)
You can then combine the date calculation directly into an annualized ROI formula. With the initial investment in B2 and ending value in B3, use:
=(B3/B2)^(1/YEARFRAC(B8,B9))-1
YEARFRAC is convenient for ordinary business analysis, but formal financial reporting may require a specific day-count convention. Follow your organization's existing standard when comparing returns across official investment reports, lending arrangements, or regulated financial documents.
Use ROI for a sales or marketing investment without overstating returns
Sales ROI should begin with the profit that the activity actually created, not the headline revenue number. The challenge is attribution: identify the incremental profit reasonably connected to the campaign, program, or sales initiative, then subtract the investment cost.
Illustrative example: A campaign produces $18,000 in incremental gross profit and costs $6,000 to run. The ROI is:
($18,000 - $6,000) / $6,000 = 2, or 200%
That result means every dollar invested generated two dollars of net profit after the campaign cost. If the $18,000 number were revenue rather than gross profit, calling the result ROI would be misleading because product costs, discounts, fulfillment, and other expenses may still be missing.
ROAS is different. A revenue-based metric such as revenue divided by ad spend can be useful for media buying, but it does not answer the same question as profit-based ROI. Label the metric clearly so a stakeholder does not compare a 5x ROAS result with a 200% ROI result as if they were interchangeable.
Calculate ROI from financial statements when the data is not in one place
Real-world ROI analysis often starts with scattered information rather than a ready-made ending value. Investment cost may appear in a cash flow record or capital expenditure schedule, operating benefit may be reflected in the income statement, and fees may sit in supporting invoices or departmental reports.
Start by deciding what the analysis is meant to measure. Are you evaluating cash received, accounting profit, a change in asset value, or operating savings? Those can all be valid return definitions, but they should not be combined casually in one formula.
Before calculating, reconcile these points:
- Period alignment: Make sure costs and benefits cover the same start and end dates.
- Taxes and fees: Decide whether the analysis is pre-tax or after-tax, and include directly related charges consistently.
- One-time costs: Include implementation, setup, disposal, and transaction costs when they were necessary to produce the return.
- Realized versus unrealized gains: State whether the ending value is cash actually received or an estimated market or book value.
A neat ROI percentage is not evidence of a sound analysis. The quality of the number depends on whether the inputs use the same return basis.
Know when IRR is a better Excel metric than ROI
ROI is effective for a simple beginning-to-end comparison, but it does not account for the timing of multiple cash flows. If an investment requires additional payments, delivers periodic income, or returns capital on irregular dates, IRR may be the more useful metric.
IRR estimates the discount rate that makes the net present value of a series of cash flows equal to zero. For a detailed walkthrough, see this guide to the IRR formula in Excel. In Excel, use =IRR(range) when cash flows occur at regular intervals, such as monthly or annually. Use =XIRR(values,dates) when the dates are irregular.
The difference is practical: ROI can show that two projects each returned 20% overall, while IRR can reveal that one generated cash much earlier. Earlier cash flows generally have greater economic value because they can be used, reinvested, or reduce financing needs sooner.
Use ROI for a clear total gain relative to cost. Use annualized ROI when comparing different holding periods. Use IRR or XIRR when the timing of several cash flows is central to the decision.
Avoid the ROI spreadsheet mistakes that change the answer
Most ROI errors are not caused by difficult math. They come from unclear definitions, inconsistent inputs, or a formula that looks plausible but answers a different question.
- Formatting 0.25 incorrectly: Format the result as a percentage to display 25%. Do not multiply by 100 and then apply percentage formatting.
- Leaving out material costs: Fees, implementation costs, commissions, and directly related expenses can materially change the result.
- Using mismatched periods: Do not compare a full-year cost with a few months of benefit unless that is the intended analysis.
- Dividing multiyear ROI by years: Use the annualized compound formula instead of simple division when comparing annual returns.
- Ignoring blank or zero investment values: A zero denominator creates #DIV/0!. Check that the initial investment cell contains a valid, nonzero amount before relying on the output.
- Mixing labels: Clearly identify total ROI, annualized ROI, ROAS, and IRR. They are useful metrics, but they are not substitutes for one another.
Negative results deserve clear labeling too. A negative ROI may reflect an actual loss, but it can also signal that costs were entered as negative values and then subtracted again. Establish a consistent sign convention before troubleshooting the formula.
Apply the method to your own investment decision
Use a simple sequence: define what counts as return, collect costs and benefits for the same period, calculate total ROI, and annualize the result when you are comparing investments with different holding periods. Switch to IRR or XIRR when multiple cash flows and their timing materially affect the decision.
Document your assumptions next to the worksheet. Then test the result by changing fees, projected proceeds, or expected operating benefit. That sensitivity check is often more useful than arguing over a single percentage that depends on uncertain estimates.
If you need help building, interpreting, or fixing the formula, FormulaBerry can generate Excel and Google Sheets formulas from a plain-language request, explain an existing calculation, and help troubleshoot a result that does not look right.